
Data is the most valuable asset most businesses have — and most businesses are not using it effectively. Data is scattered across dozens of systems, it is inconsistently formatted, it arrives late, and the reports that come out of it are too slow and too shallow to drive real decisions.
At Nimaisoft, we build the plumbing, the structure, and the intelligence layer that turns your scattered data into a competitive advantage. We work across the entire data value chain — from ingestion and storage to transformation, visualisation, prediction, and governance.
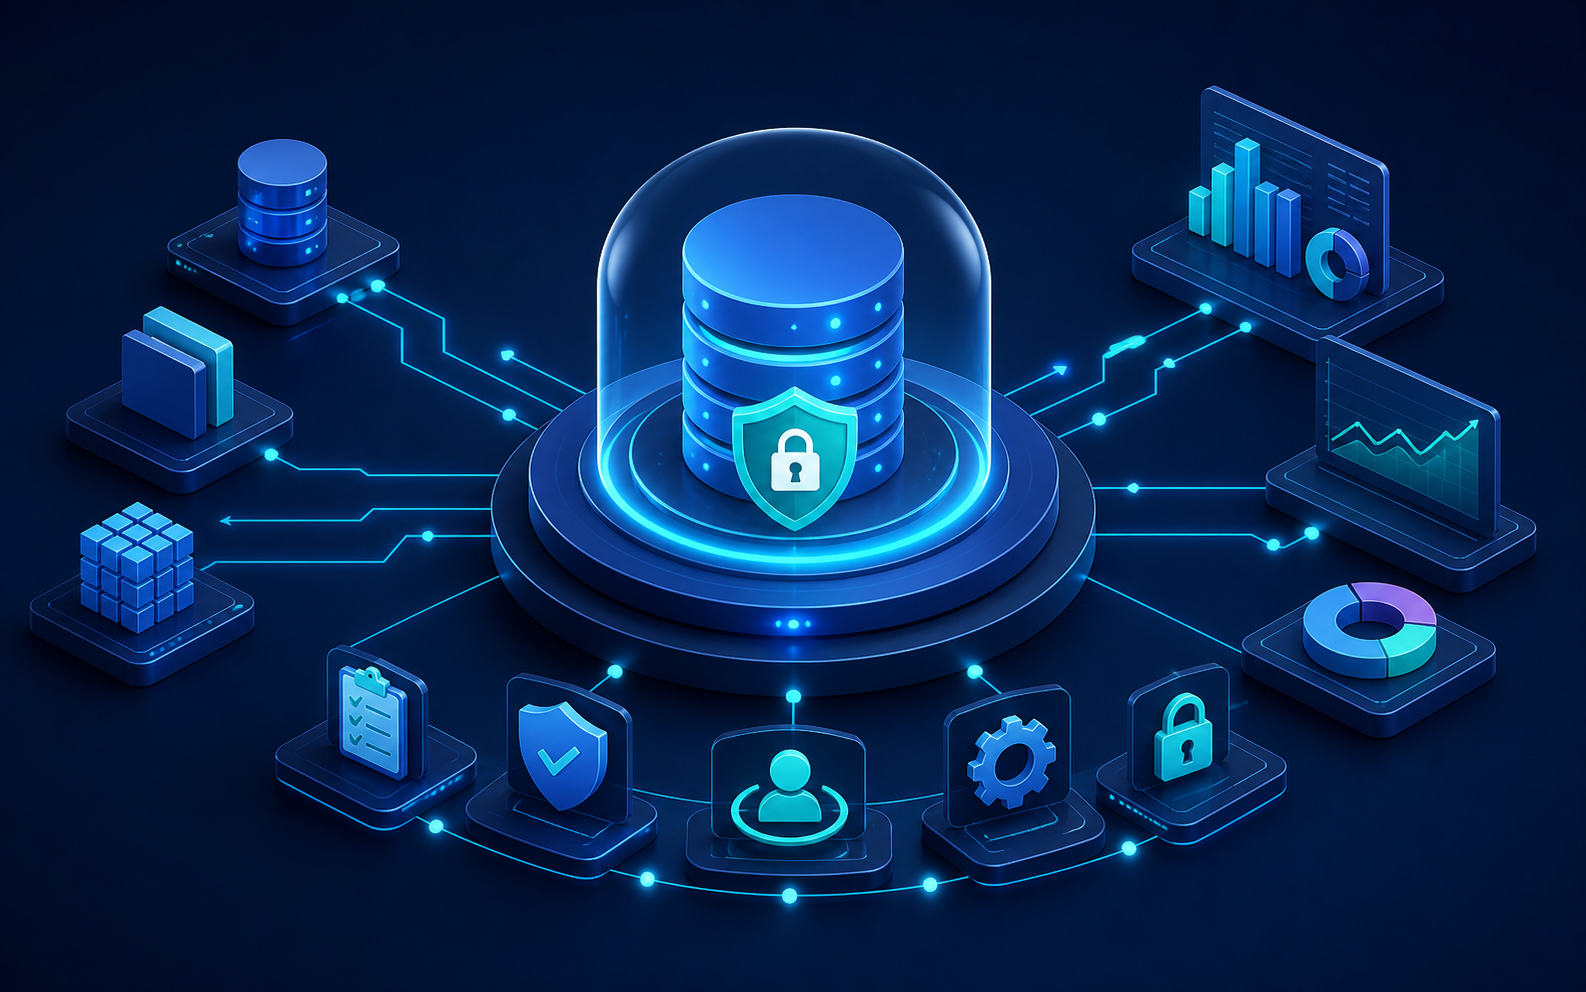
Most data problems are not technology problems — they are strategy problems. Businesses invest in expensive data tools but do not know what questions they want to answer, who owns the data, what quality standards it should meet, or how it should be governed.
We help you define a data strategy that aligns with your business goals — identifying the key data assets you have, the key decisions you need data to support, and the roadmap to get there. We also design governance frameworks that define data ownership, quality standards, access controls, and compliance obligations.
What we deliver:
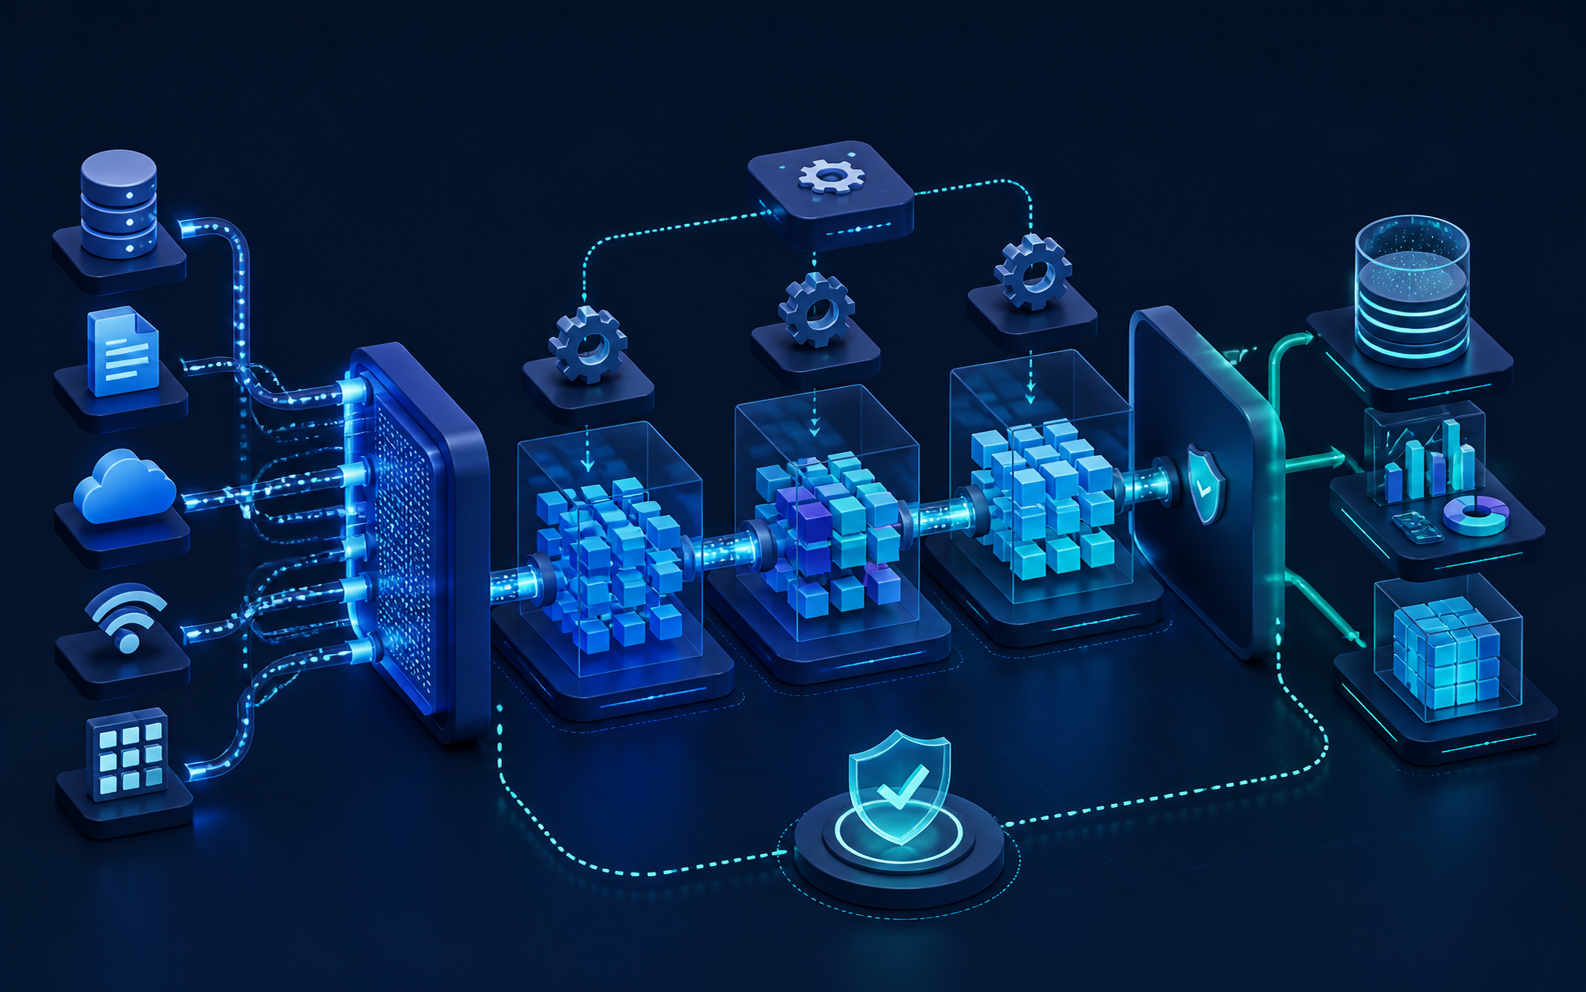
Data engineering is the practice of designing and building the systems that move data from where it is generated to where it is needed — reliably, efficiently, and at scale. Without robust data engineering, every analytics and AI initiative is built on shaky ground.
We build data pipelines that ingest data from your operational databases, SaaS applications, IoT devices, APIs, and flat files; transform it into consistent, clean formats; and load it into your analytical data store. We handle both batch and streaming workloads.
Our engineering stack:
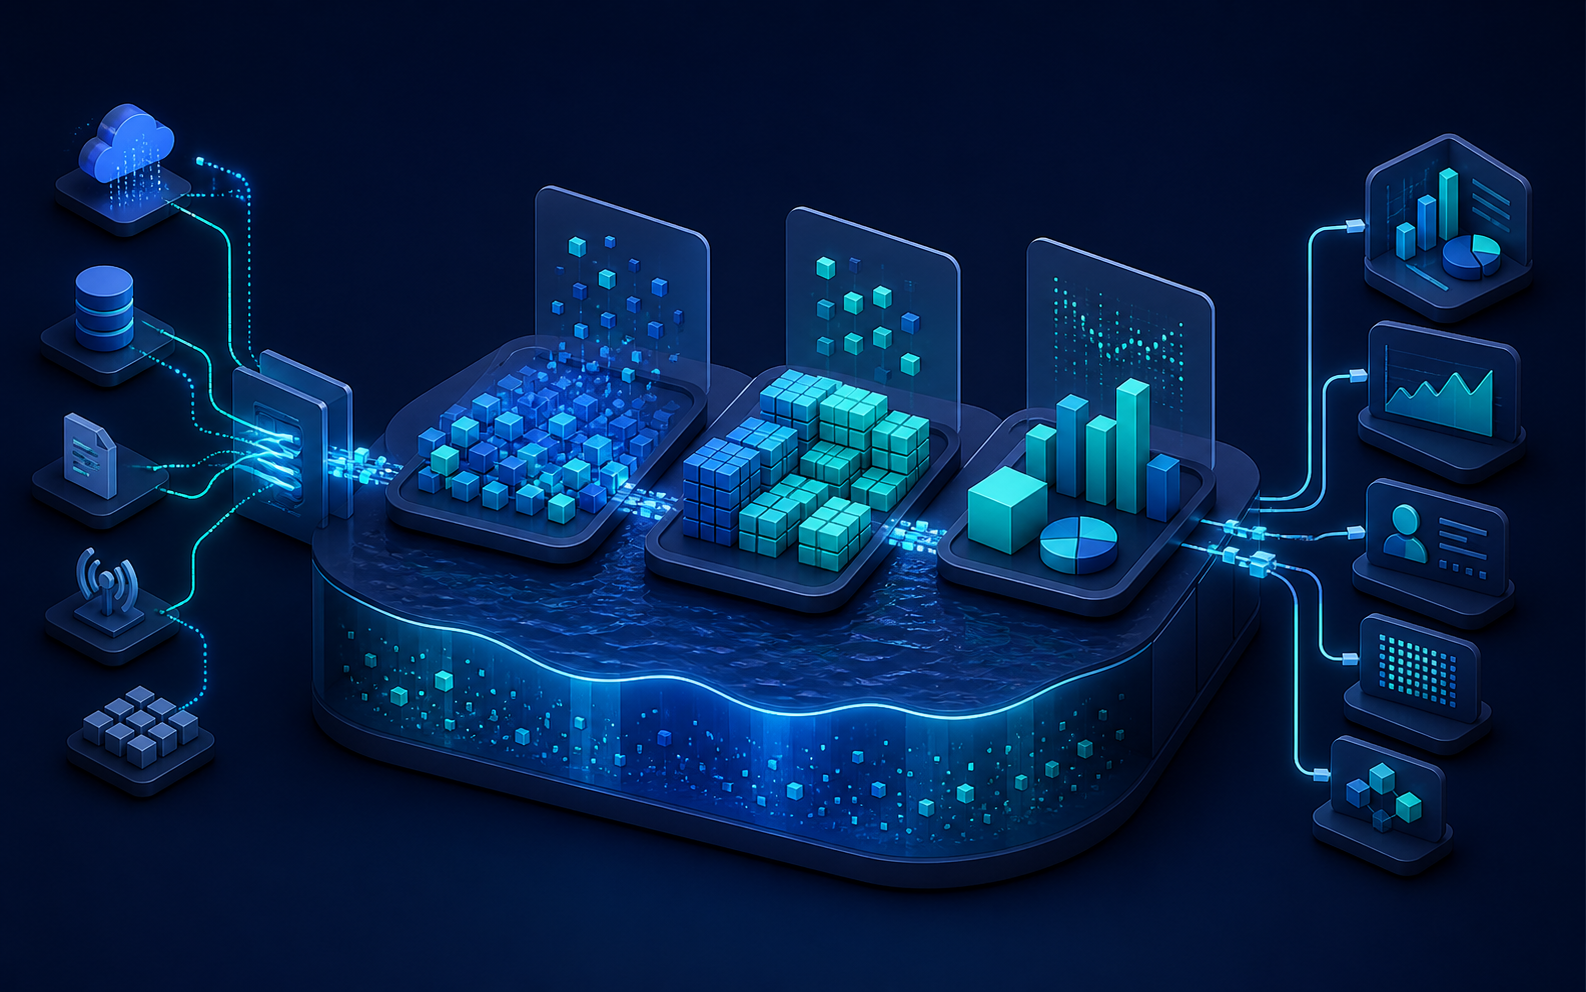
The data lakehouse is the modern evolution of the data warehouse — combining the low-cost scalable storage of a data lake with the structure, governance, and query performance of a data warehouse. It is the right architecture for businesses that need both exploration flexibility and reporting consistency.
We design and implement data lakehouse architectures on Databricks, Snowflake, BigQuery, and Amazon Redshift. We implement medallion architecture (Bronze, Silver, Gold layers) to organise data from raw ingestion through business-ready reporting tables, with proper partitioning, indexing, and access control at each layer.
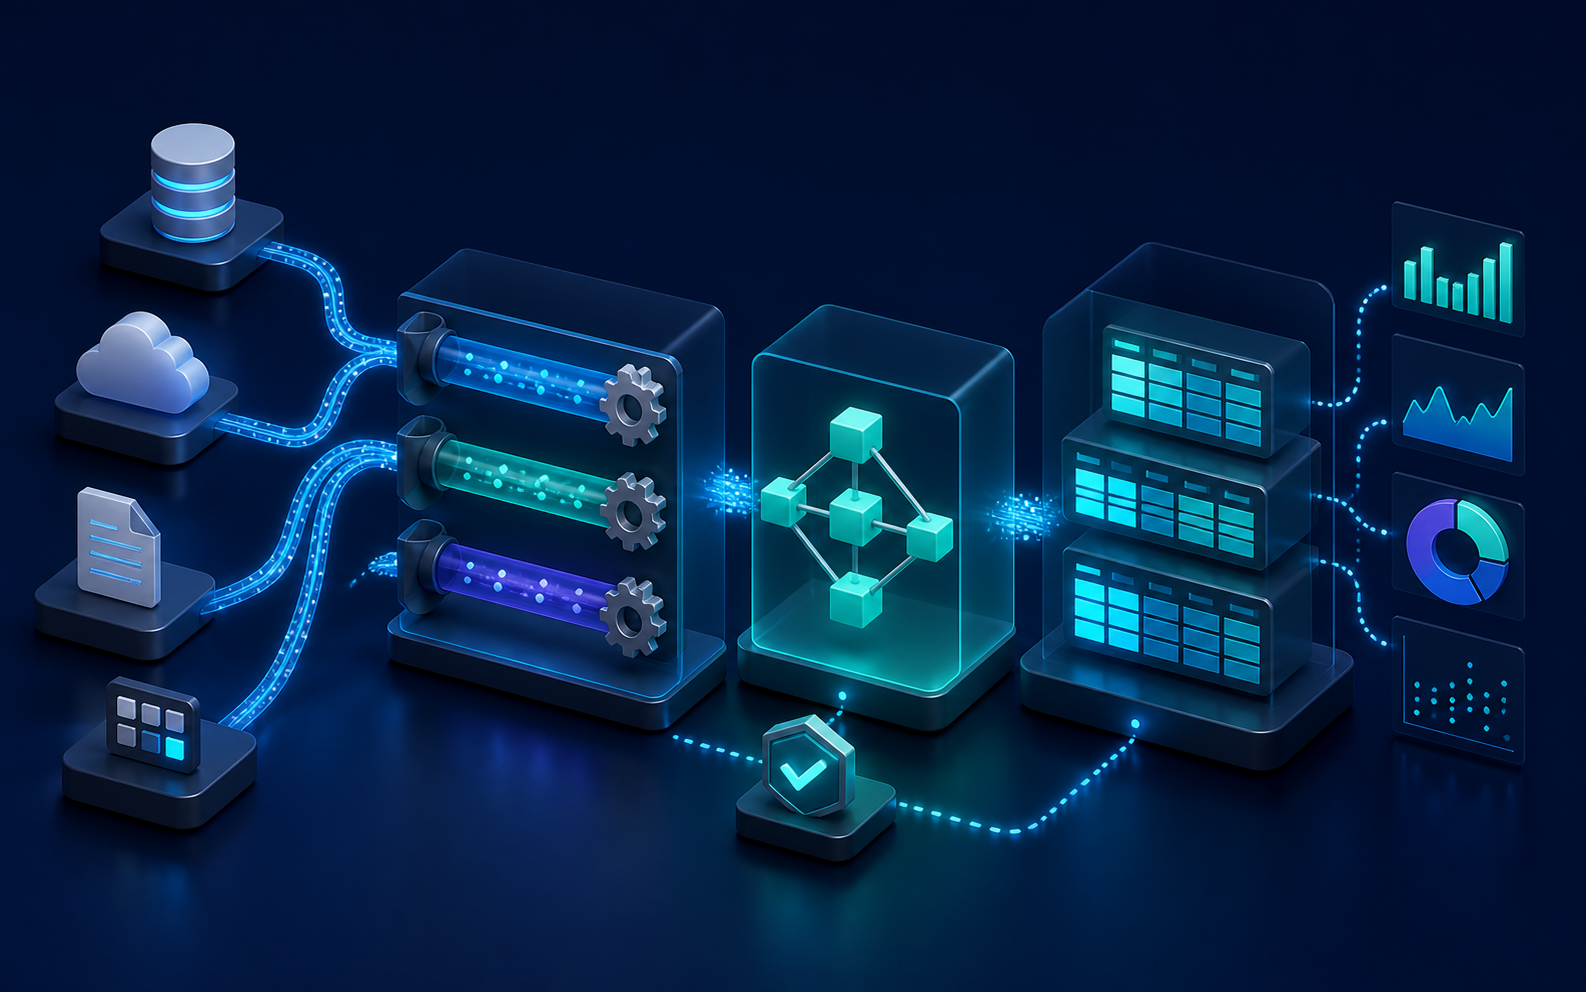
ETL (Extract, Transform, Load) and the modern variant ELT (where raw data is loaded first and transformed inside the warehouse) are the backbone of every data platform. The quality of your ETL/ELT logic determines the reliability of every report and analysis downstream.
We implement ELT pipelines using dbt — the industry-standard transformation tool that brings software engineering practices (version control, testing, documentation) to data transformation. Every transformation is modular, testable, and documented, so your team understands what every number in a dashboard actually means.
Dashboards are only valuable when they are used — and dashboards are only used when they are fast, intuitive, and answer the questions that matter to the people looking at them. Too many BI projects deliver dashboards that gather dust because they are too complex or too slow.
We design and build BI solutions using Power BI, Tableau, Metabase, and Grafana. We start with a requirements workshop to understand what decisions each role needs data to support, then design dashboards around those decisions rather than around available data. Every dashboard is performance-optimised and mobile-accessible.
Dashboard types we build:
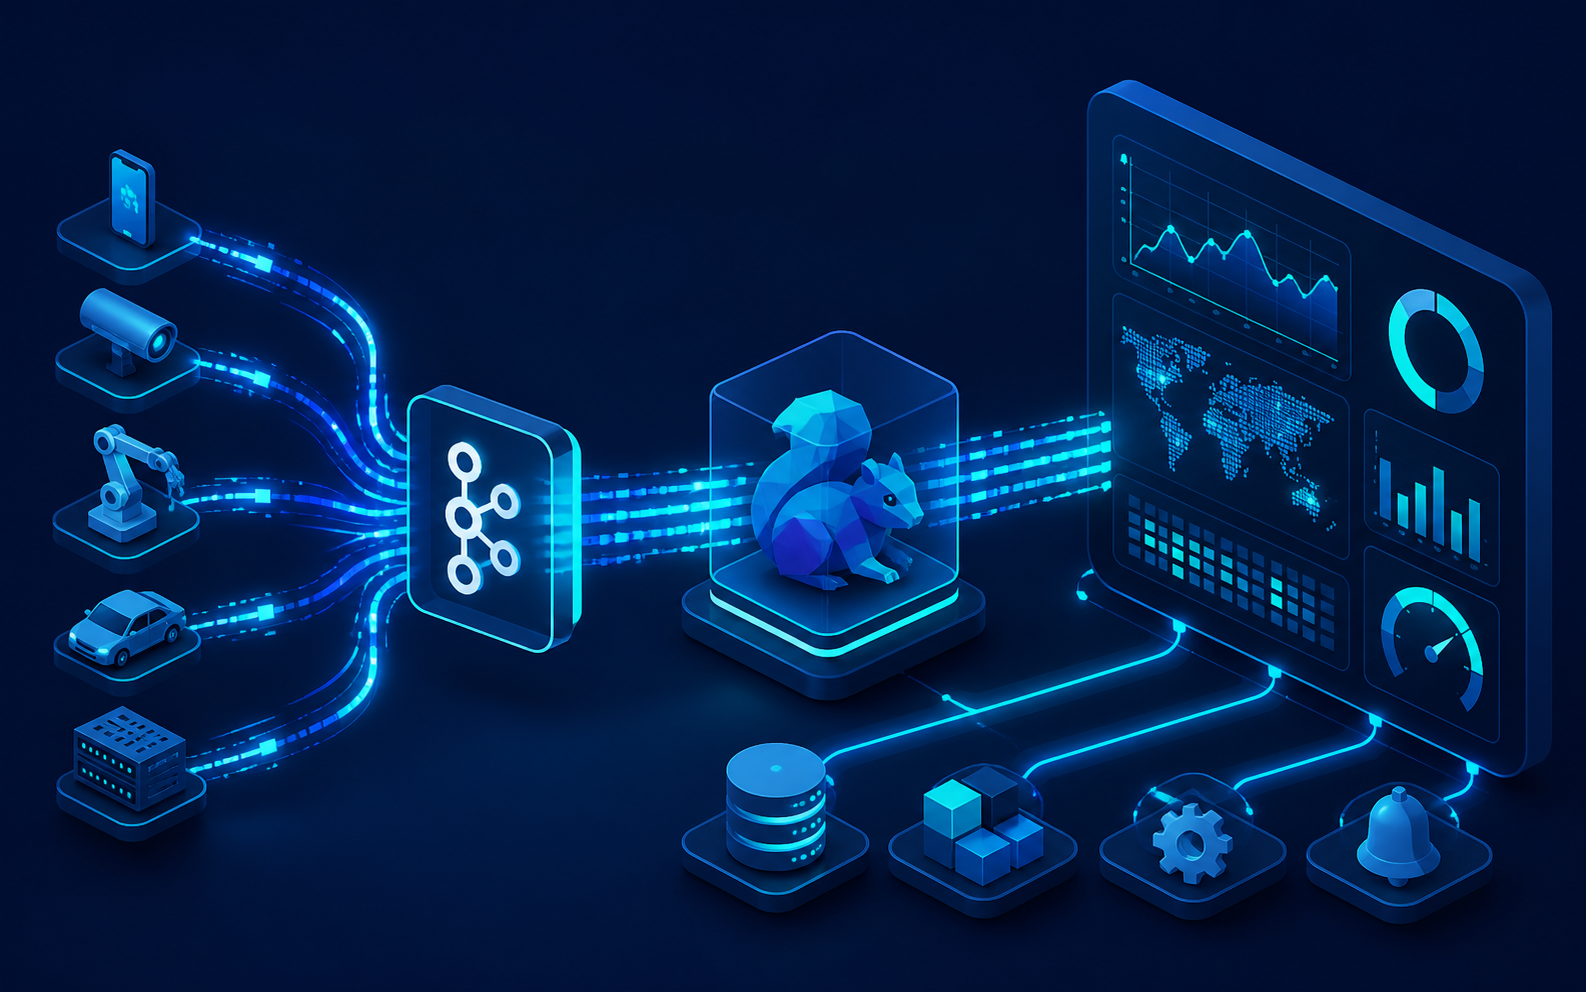
Many business decisions cannot wait for yesterday's batch report. Real-time analytics processes data as it arrives — enabling instant fraud detection, live inventory tracking, real-time personalisation, and immediate operational alerts.
We build real-time analytics systems using Apache Kafka as the event streaming backbone and Apache Flink or Kafka Streams for stateful stream processing. Data flows from source systems through the streaming pipeline into live dashboards and alerting systems within seconds of events occurring.
Predictive analytics uses historical data and machine learning to forecast future outcomes — enabling businesses to act before problems occur rather than reacting after the fact. Demand forecasting, churn prediction, equipment failure prediction, and financial planning are all powered by predictive analytics.
We build predictive models using Python, scikit-learn, XGBoost, and time-series frameworks like Prophet and NeuralProphet. We do not just build models — we integrate them into your business processes so predictions automatically trigger actions, notifications, or planning workflows.
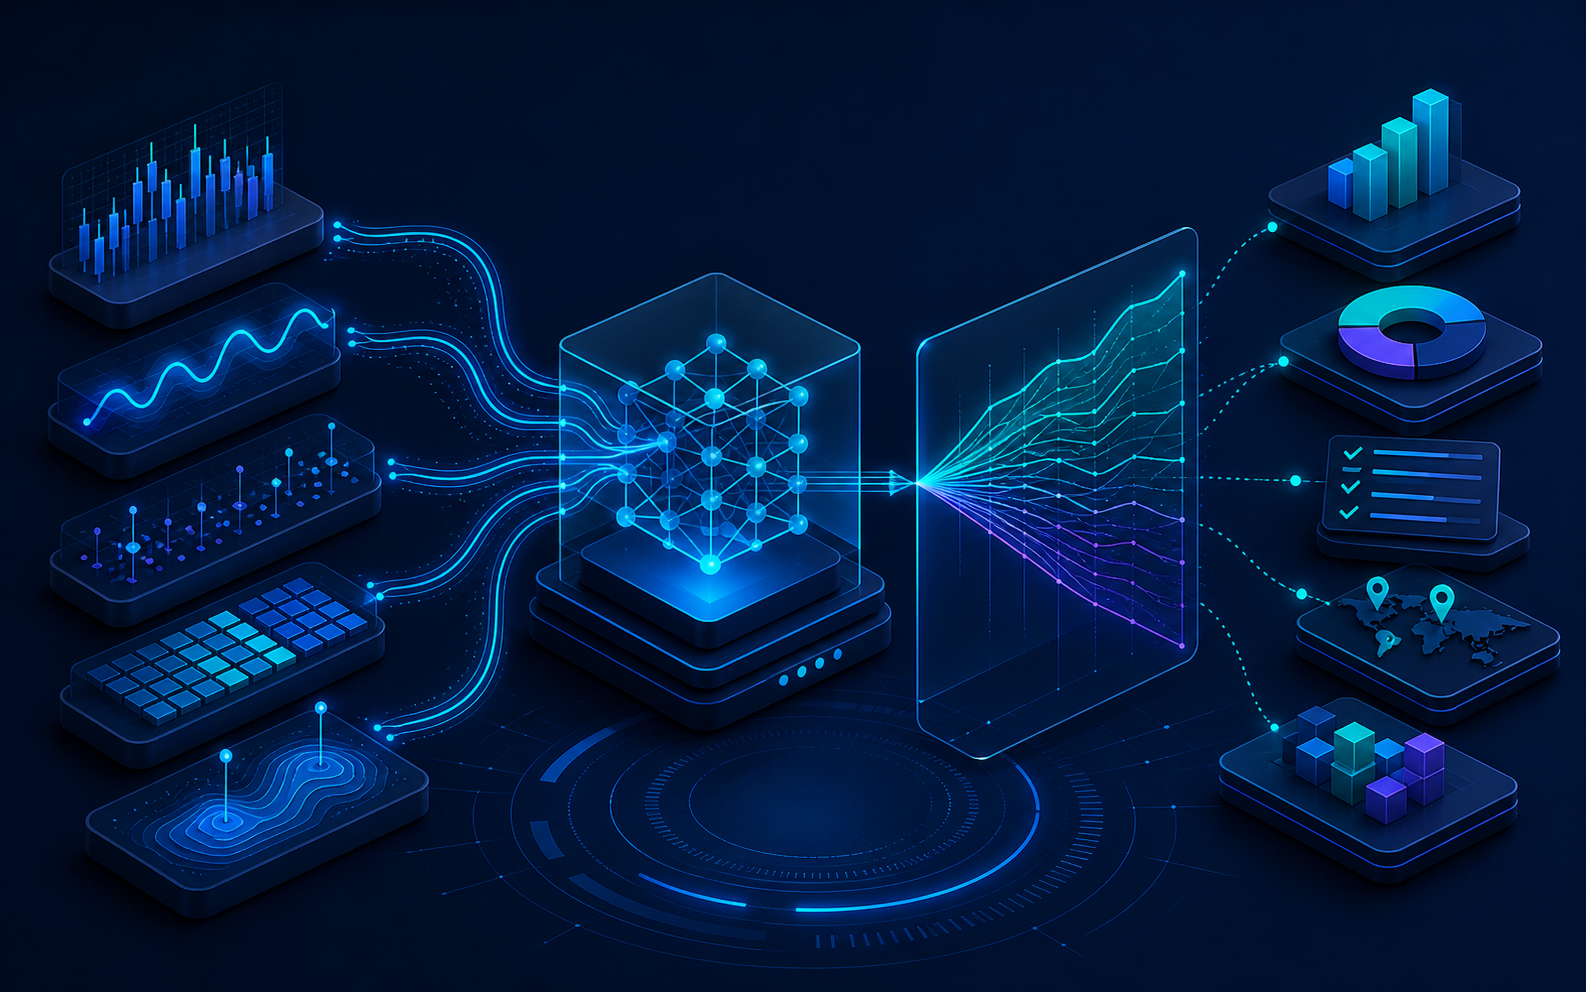
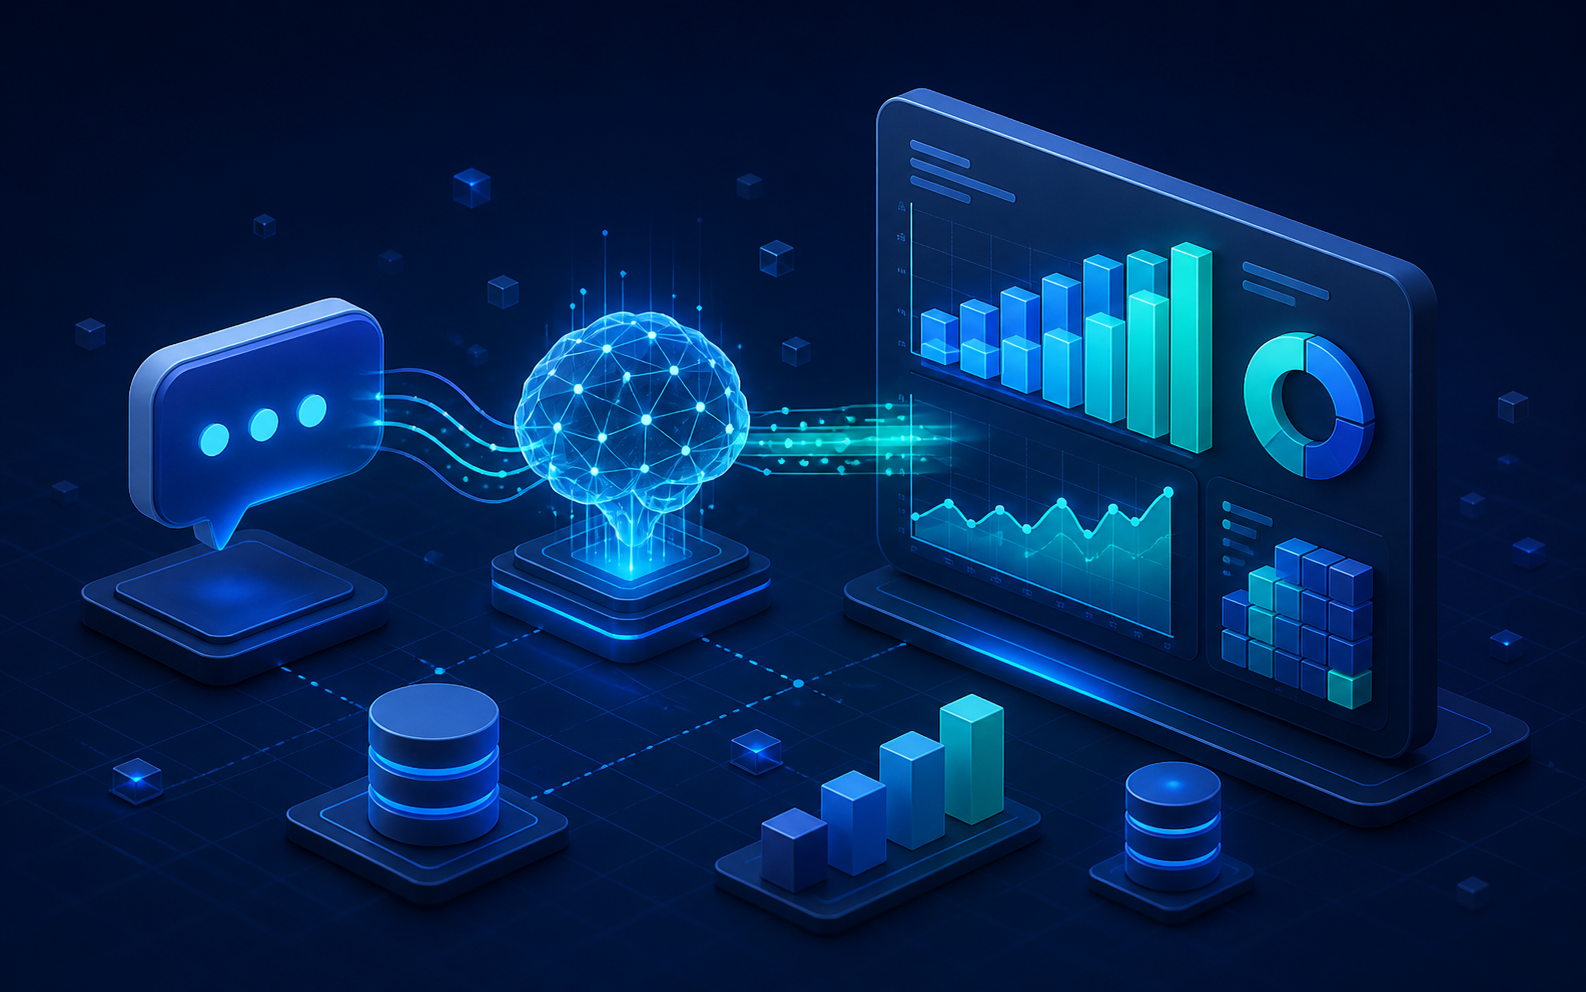
The next frontier in business intelligence is AI-augmented analytics — where AI helps users find insights they did not know to look for, and where non-technical users can query data in plain English instead of writing SQL.
We build natural language query interfaces that allow business users to ask questions like "What were our top-selling products last quarter in the southern region?" and get instant chart responses. We also implement AI-generated insight summaries that proactively surface anomalies and trends from your data without anyone needing to look for them.
Many businesses are sitting on years of valuable data locked in legacy systems — old databases, discontinued applications, and on-premise data warehouses that are expensive to maintain and difficult to integrate with modern tools.
We plan and execute data migrations that move your historical data to modern platforms without losing data integrity. We handle schema transformation, deduplication, data quality validation, and cutover planning to ensure migrations complete without disrupting business operations.


Bad data costs businesses enormously — wrong decisions based on incorrect data, manual rework to fix data quality issues, and loss of trust in reporting systems. Data quality needs to be monitored continuously, not checked occasionally.
We implement data observability platforms that continuously monitor your data pipelines for freshness, completeness, accuracy, and consistency. We set up automated data quality tests in dbt, implement alerting for data anomalies, and build lineage graphs that show where every piece of data comes from and how it has been transformed.
Sometimes standard BI tools cannot deliver the visualisation experience your users need — particularly for public-facing data products, embedded analytics, or highly specialised industry reporting. Custom visualisations give you complete control over the user experience.
We build custom data visualisation applications using D3.js, Plotly, ECharts, and Recharts, embedded in React or Vue.js web applications. We also build automated reporting systems that generate PDF or Excel reports on a schedule and deliver them to stakeholders by email.

India's Digital Personal Data Protection (DPDP) Act 2023 establishes legal obligations for how businesses collect, store, process, and share personal data. Non-compliance carries significant financial penalties and reputational risk.
We help businesses assess their current data practices against DPDP Act requirements, implement technical controls for consent management, data minimisation, access controls, and retention policies, and design data architectures that are privacy-preserving by design.